Clustering Model
46 minutesWhat Is a Clustering Model?
A clustering model is a technique used to automatically group data points based on similarity. It is a common application in machine learning, and its goal is to assign similar data points to the same group—known as a cluster—while separating data points that differ significantly into different clusters. With clustering analysis, users can examine relationships among data points and utilize it as an efficient statistical tool, especially when processing large datasets.
Supervised vs. Unsupervised Learning
Machine learning methods can generally be divided into two categories: supervised learning and unsupervised learning. "Supervised" refers to whether the training data is labeled during the model training process.
A typical machine learning workflow can be summarized as: Input training data → Build the model → Compare predictions with labeled data → Adjust the model, and the model continues to improve through iteration. The quality of the training data greatly affects the model; if incorrect or poorly labeled data is used, the resulting model will naturally perform poorly.
In supervised learning, the dataset is manually labeled, providing the model with the correct answers during training. The model learns its classification rules based on these labels. Common applications include image classification and speech recognition.
In contrast, unsupervised learning uses completely unlabeled data. It is widely applied to tasks such as data grouping—like the clustering approaches introduced in this article—and is often used when users lack expertise to label data but still want to explore underlying patterns.
Additionally, semi-supervised learning provides a compromise between the two. When pure unsupervised learning yields suboptimal results, users may label only a portion of the data. The model then learns from both the labeled and unlabeled data, reducing annotation cost while improving accuracy.
Common Clustering Algorithms
After understanding the preprocessing steps, we can introduce several commonly used clustering methods.
K-means Algorithm
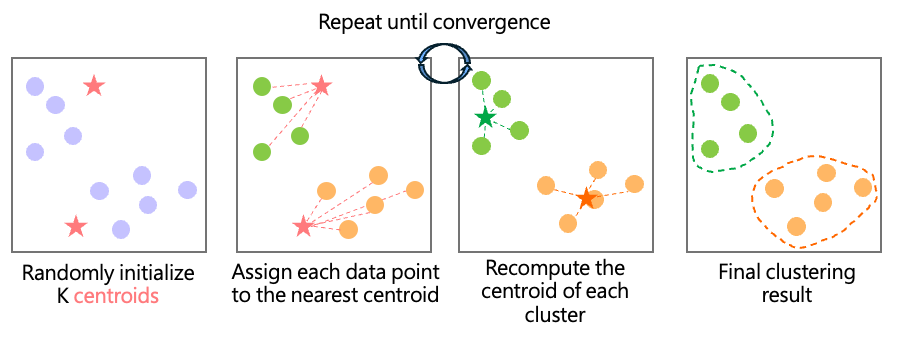
K-means is one of the most widely used clustering algorithms in unsupervised learning. One advantage is that users can specify the desired number of clusters, K.
For example, if we want to divide data into two clusters (K=2), the algorithm begins by randomly selecting two initial centroids, then repeatedly performs:
Compute the distance from each data point to each centroid and assign each point to the nearest centroid.
Recalculate the centroid of each cluster.
This process iterates until the assignments stabilize.
How to Choose the Number of Clusters?
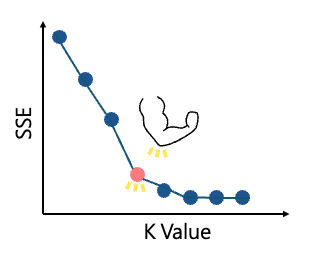
- Elbow Method
The first common technique is the elbow method. Since K-means groups data based on distances to centroids, the within-cluster distance should ideally be small. The elbow method computes the Sum of Squared Errors (SSE) for K = 2 to N. When increasing K no longer provides substantial improvement, the SSE curve forms an "elbow"—indicating the optimal K.
- Silhouette Method
The second method uses the silhouette coefficients(i)to evaluate clustering performance: \(s(i) = \frac{b(i) - a(i)}{\max\{a(i),\, b(i)\}}\).a(i)average distance between point i and all other points in the same cluster (intra-cluster similarity).b(i)average distance between point i and points in the nearest neighboring cluster (inter-cluster difference).-1<s(i)<1,closer to 1: good clustering (point fits well in its assigned cluster), closer to -1: poor clustering (point likely belongs elsewhere) Evaluating average s(i) across different K values helps determine the optimal number of clusters.
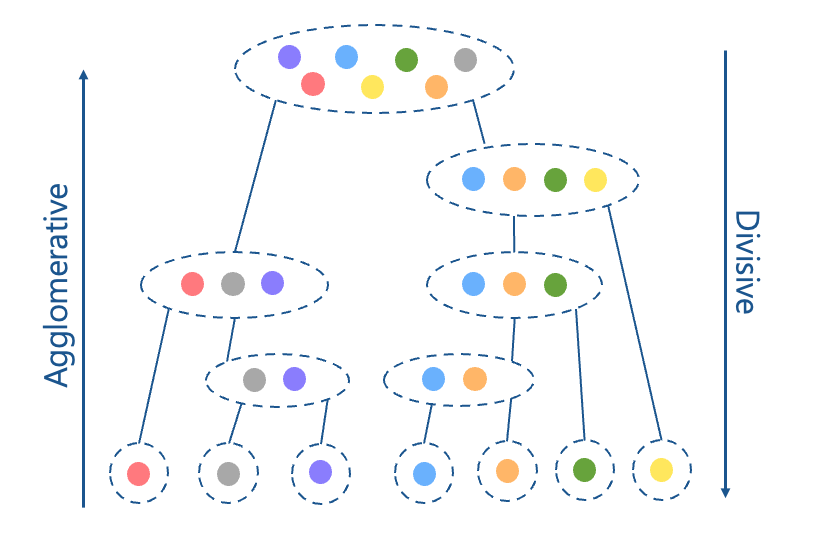
Hierarchical Clustering
Hierarchical clustering organizes data into a tree-like structure. There are two main approaches:
-
Divisive (top-down): start with all data as one cluster, then recursively split into smaller groups.
-
Agglomerative (bottom-up): start with each point as an individual cluster and iteratively merge clusters until only one remains.
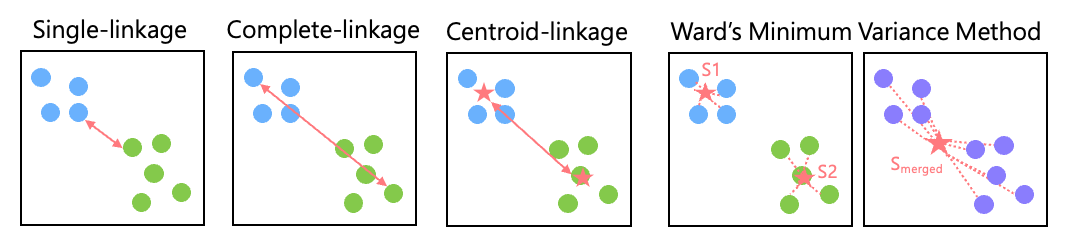
 Common linkage strategies include:
Single-linkage: minimum distance between points from two clusters
Common linkage strategies include:
Single-linkage: minimum distance between points from two clusters
Complete-linkage: maximum distance between cluster points
Average-linkage: average distance across all inter-cluster point pairs
Centroid-linkage: distance between the centroids of two clusters
Ward’s Minimum Variance Method: merges clusters that cause the smallest increase in overall variance
(calculating S₁, S₂ and Smerged for variance DS = Smerged– (S₁ + S₂))
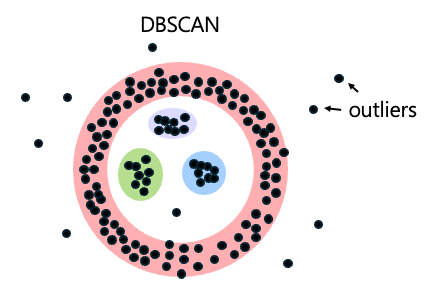
DBSCAN(Density-Based Spatial Clustering of Applications with Noise
Unlike K-means, DBSCAN automatically determines the number of clusters based on data density and identifies outliers as noise.
It is especially useful when K-means produces unsatisfactory results or when the number of clusters is unknown.
Applications in Pathology
See: CLAM: Clustering-constrained 條件式叢集
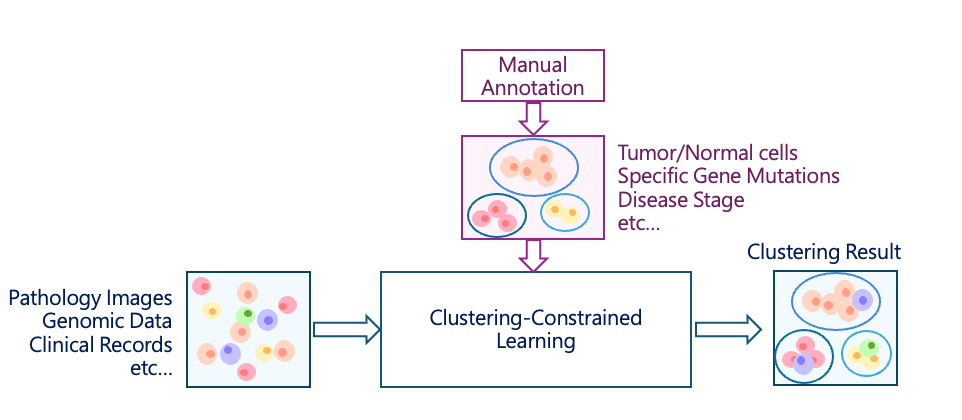
In typical clustering models, data is grouped solely based on learned features. For example, when applied to patient data, the model might cluster patients based on history, symptoms, or demographics—without any manual labels. This is unsupervised learning.
However, the resulting clusters may not align with clinically meaningful categories. This is where clustering-constrained (semi-supervised) methods are useful.
By providing a small number of labeled samples, the model can be guided to organize data according to medically relevant characteristics—such as distinguishing normal from abnormal cells or focusing on specific morphological patterns.
This approach reduces annotation effort while improving the clinical relevance and accuracy of the clustering results.